Chrome DevTools panel Manifest V3 Free
The WebSocket inspector DevTools forgot.
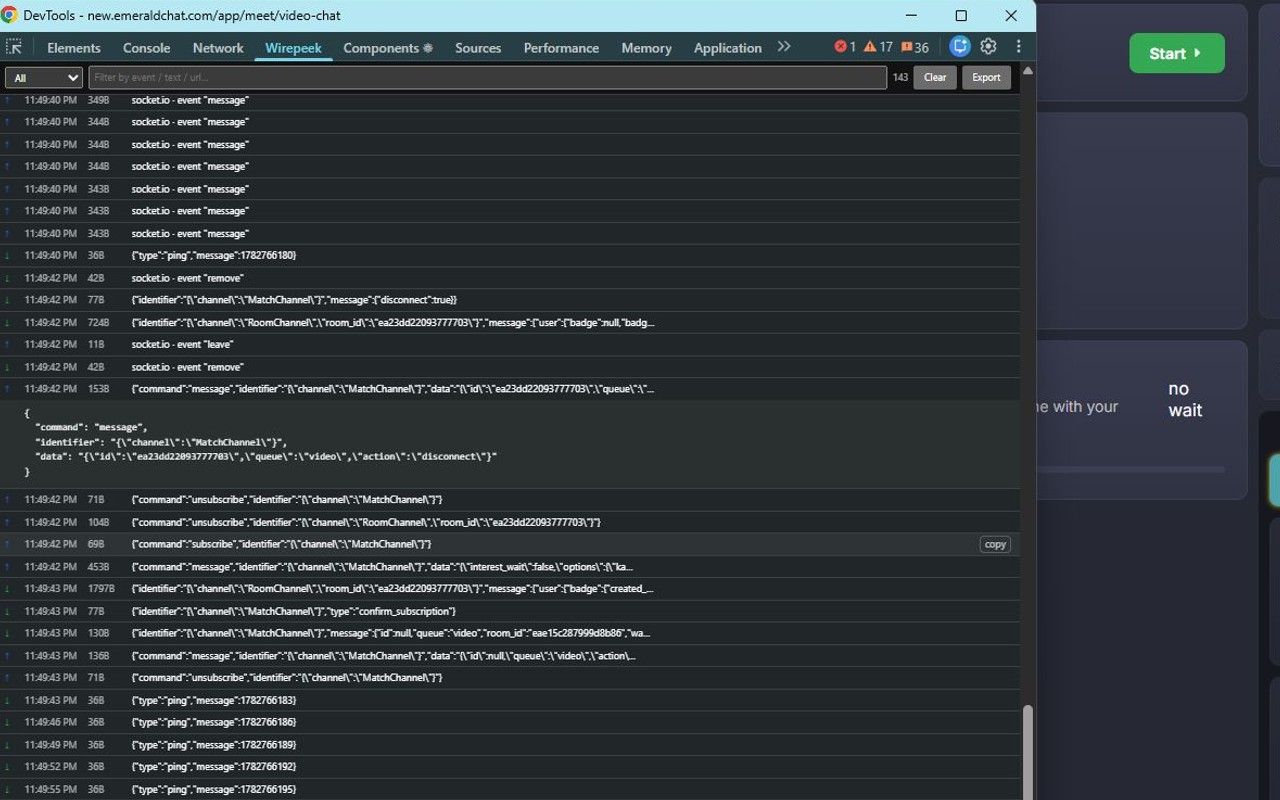
Wirepeek adds a panel to Chrome DevTools that captures every WebSocket frame your page sends and receives — and decodes it. socket.io, engine.io, SignalR, MQTT, compressed and binary payloads, read as structure instead of as 42["msg",{…}].
No account. No servers. Capture is off until you turn it on.
The difference
Same connection. One of these you can read.
The native Network tab shows WebSocket frames as the wire carries them — protocol framing included, binary payloads as an opaque blob, and nothing at all for sockets that opened before you hit F12. Wirepeek starts at document_start and reads the frames as your app meant them.
Network → WS → Messages
native42["message",{"user":"ana","text":"hi"}]
2
3
42["presence",{"n":184}]
Binary Message (214 bytes)
— open DevTools first, or you missed
the handshake entirely
Wirepeek panel
decodedevent message { user: "ana", text: "hi" } engine.io ping · pong event presence { n: 184 } MessagePack { id: "MjE4…", body: {…} } — capture survives reloads, and the socket.io handshake is the first row
Decoders
One switch: try to decode.
Wirepeek unwraps a payload as far as it can and shows you where it stopped. Every decoder is strict — it either consumes the whole payload or hands the frame back raw, so you never read a plausible-looking mistranslation. What it genuinely cannot read (encrypted or opaque blobs) is flagged red instead of guessed at.
Every frame, including the ones DevTools misses
Wirepeek patches WebSocket.prototype in the page's main world before socket.io grabs the native reference. Frames survive reloads, and iframe traffic is captured too — with a “main frame only” toggle when the ads get noisy.
A JSON tree, not a wall of escapes
Pretty-printed, collapsible, syntax-coloured. SignalR and ActionCable payloads that nest JSON inside a string field get expanded. base64 images render inline. Encrypted blobs turn red so you stop trying.
Filter, search, export
Filter by direction, connection, event name, or text — substring or regex — and search inside the decoded content, not just the raw frame. Copy one frame, or export the session (or a selected range) as JSON.
Where your traffic goes
Nowhere. That's the whole answer.
You are pointing this at your own application's traffic — often a staging environment, sometimes production, usually with tokens in it. So the design is boring on purpose:
No backend. Wirepeek has no server to send anything to. Frames live in the extension's memory and in storage.session, which the browser clears when it closes.
Capture is opt-in, per tab. Default is off. Nothing is recorded until you arm that tab, and it disarms itself when you close the panel.
Read-only. Wirepeek observes frames. It does not modify, replay, or block your app's traffic.
No accounts, no analytics, no ads. One permission in the manifest: storage. There is no telemetry to opt out of.
Full details in the privacy policy.
Questions
Before you install it.
Why can't I read my socket.io messages in Chrome DevTools?
You can see them — you just can't read them. The Network tab shows the wire format: 42["chat message",{…}], where 4 is the engine.io message type and 2 is the socket.io EVENT type, plus a bare 2 ping every 25 seconds mixed into your app's traffic. Binary frames show up as “Binary Message (n bytes)”.
There's also a timing problem: DevTools only records frames from the moment you open it, so the handshake and everything before it is gone. Wirepeek installs at document_start and keeps capturing across reloads.
Field guide: how to read socket.io frames by hand — every packet type, and the four cases where hand-reading stops working.
How is this different from Postman, Firecamp or wscat?
Those are WebSocket clients: you open a connection yourself and send frames to a server. Useful, different job.
Wirepeek is an inspector: it shows the traffic your application is already exchanging, in the page you're debugging, with the real session and the real tokens. You don't connect to anything.
Full comparison: clients, inspectors and proxies — including the cases where Wirepeek is the wrong tool.
Does it work with SignalR, ActionCable, MQTT or a custom protocol?
Partly, and honestly: socket.io and engine.io are decoded natively. For the rest, the decoding pipeline unwraps what's actually in the payload — nested JSON in string fields (SignalR, ActionCable), gzip and deflate, base64, JWT, MessagePack, CBOR, Thrift Compact, JSON embedded in binary frames.
That covers a lot of “custom” protocols in practice, because most of them are one of those layers with a header bolted on. What it can't parse stays raw, and encrypted payloads are flagged rather than guessed.
Does Wirepeek send my traffic anywhere?
No. There is no backend, no account, and no analytics. Captured frames stay in the extension on your machine, and the only permission it requests is storage. Capture is off by default and armed per tab, by you.
Can it replay or modify frames?
Not today. Wirepeek is read-only: capture, decode, filter, export. Replay and mocking are the obvious next step, and they'll be built if enough people ask for them — tell me which protocol you're staring at.
What does it cost?
Nothing. The whole inspector is free, with no usage limits and no sign-up. Chrome 116 or newer (it uses a Manifest V3 main-world content script), available in English, Romanian, French, German, Spanish, Italian and Russian.
Reading
Written for the problem, not for the product.
Three pages that are useful whether or not you install anything. They're also the honest answer to “is this the right tool for me”.
How to read socket.io messages in DevTools
Every engine.io and socket.io packet type, how to decode 42[…] by hand, and the four cases where hand-reading stops working.
WebSocket frames not showing in DevTools
The seven reasons the Messages tab is empty while your app is clearly talking — and how to tell which one you have.
ComparisonClients, inspectors and proxies
Postman, wscat, Wireshark, DevTools, extensions: which category solves your problem, including when Wirepeek is the wrong choice.
Open DevTools. Pick the Wirepeek tab.
That's the whole setup.